


The decline in cancer mortality is about much more than smoking
I respond to the claim that the decline in cancer mortality is mostly, or almost entirely, just because of the decline in smoking.

I often write about and create data visualizations of long-term trends in health and mortality.
One example is a chart showing the decline in US cancer death rates since the 1990s, which is shown below. It’s not an enormous decline, but it’s substantial.
The age-standardized death rate from cancer has declined by around a third since 1990 in the US. This means that, on average, people of a given age in 2021 had a third lower risk of cancer death than people of the same age in 1990. In many other high-income countries, the trend is similar, with a general decline since the late 80s or early 90s.

The early 1990s were the peak of cancer mortality in many richer countries. As cigarette smoking rose during the first half of the 20th century, cancer rates followed. Lung cancer became the most common cause of cancer death, and pushed overall cancer death rates up.

From the 1960s, following the growing public consensus that smoking caused lung cancer — such as in the US Surgeon General’s report — smoking rates began to decline. Because there’s a decades-long gap between smoking and cancer death, it took a few more decades for cancer mortality to decline, which you can see in the chart.
That’s the part of the story I agree with.
But here’s the part I don’t agree with — a claim I’ve heard many, many times1 — that almost all of the decline in cancer mortality is due to the decline in smoking, and the other factors account for only a small remaining part.
Maybe people believe this because lung cancer is the biggest cancer cause of death, or that smoking increases the risk of multiple cancers, including oral cancer, liver cancer, and bladder cancer, not just lung cancer. That’s true, and I’ve written about it before. But it doesn’t follow that almost all of the decline in cancer mortality is due to the decline in smoking.
In my view, without smoking, we probably would have seen cancer mortality decline much earlier.2 There are major cancer types — particularly stomach and colorectal cancer — whose death rates started declining much before the decline in smoking; and this is important because they were previously some of the most common causes of cancer death.
But there are other reasons as well. We’ve also seen substantial declines in childhood cancer mortality, even though children’s cancers aren’t caused by smoking, but typically by inherited or spontaneous genetic mutations very early in development; and the reasons for progress against childhood cancers also apply to adult cancers. We also have evidence from other studies including RCTs that some cancer therapies result in large reductions in cancer progression and death.
I’d go even further. This isn’t just about cancer mortality. For several cancers, incidence rates have been declining as well. This should be fairly intuitive for lung cancer, whose incidence has declined as smoking rates have fallen, but it’s also the case for some other types, like cervical, stomach, and liver cancers. As I’ll describe some of the causes for the declines in cancer mortality, you’ll notice that some of them have large effects on whether those cancers develop at all, not just their mortality.3
Finally, I’ll explain a deeper issue with the whole idea: we can’t neatly divide the causes of an outcome into slices that add up to 100%. Even if one factor, like the decline in smoking, has had a large effect, that doesn’t mean the remaining causes only account for a small remaining part. This misinterprets how causes work together in the real world.
As usual, I’ll pay you if you spot an error in this post, aside from minor typos or grammatical errors. Please let me know if you find one, so I can fix it.
Smoking drove up cancer incidence and mortality during the 20th century
There’s always a risk, when you write something like this, that people will take it to mean something completely different. So just to be clear, I’m not saying that smoking was unimportant.
Smoking drove a large rise in lung cancer mortality during the 20th century, and this pushed up overall cancer mortality as well.
Cancer death became more common in the mid- or late-20th century than it was before. You can also see a longer-term visualization of this from France here, where the data spans 1925 onwards.

The impact of smoking on cancer is very large. On average, smokers have a 21 times higher risk of lung cancer death in the US than never-smokers. They also have a higher risk of various cancers, including bladder, oral, kidney, and pancreatic cancers, and some cardiovascular diseases, as the chart below shows.
(Note that the raised risk of cancer depends on the type and frequency of smoking; this data is based on the average cigarette smoker in the US.)

You can see that smoking raises the risk of death from various other cancers and cardiovascular diseases, though to a lesser extent than lung cancer.
One reason is that the carcinogens in cigarettes — such as polycyclic aromatic hydrocarbons (PAHs) and tobacco-specific nitrosamines — can cause cancers in multiple organs, including the mouth, throat, larynx, lungs, esophagus, bladder, pancreas, kidney, and even the cervix. Another reason is that tumors can metastasize, meaning they migrate from their original site to other parts of the body.4
I suspect this is why people claim that the decline in cancer mortality is almost entirely because of the decline in smoking. But I disagree for several reasons.
Stomach and colorectal cancer mortality began to decline before smoking did
Before lung cancer became common, stomach and colorectal cancers were among the most common causes of cancer death.
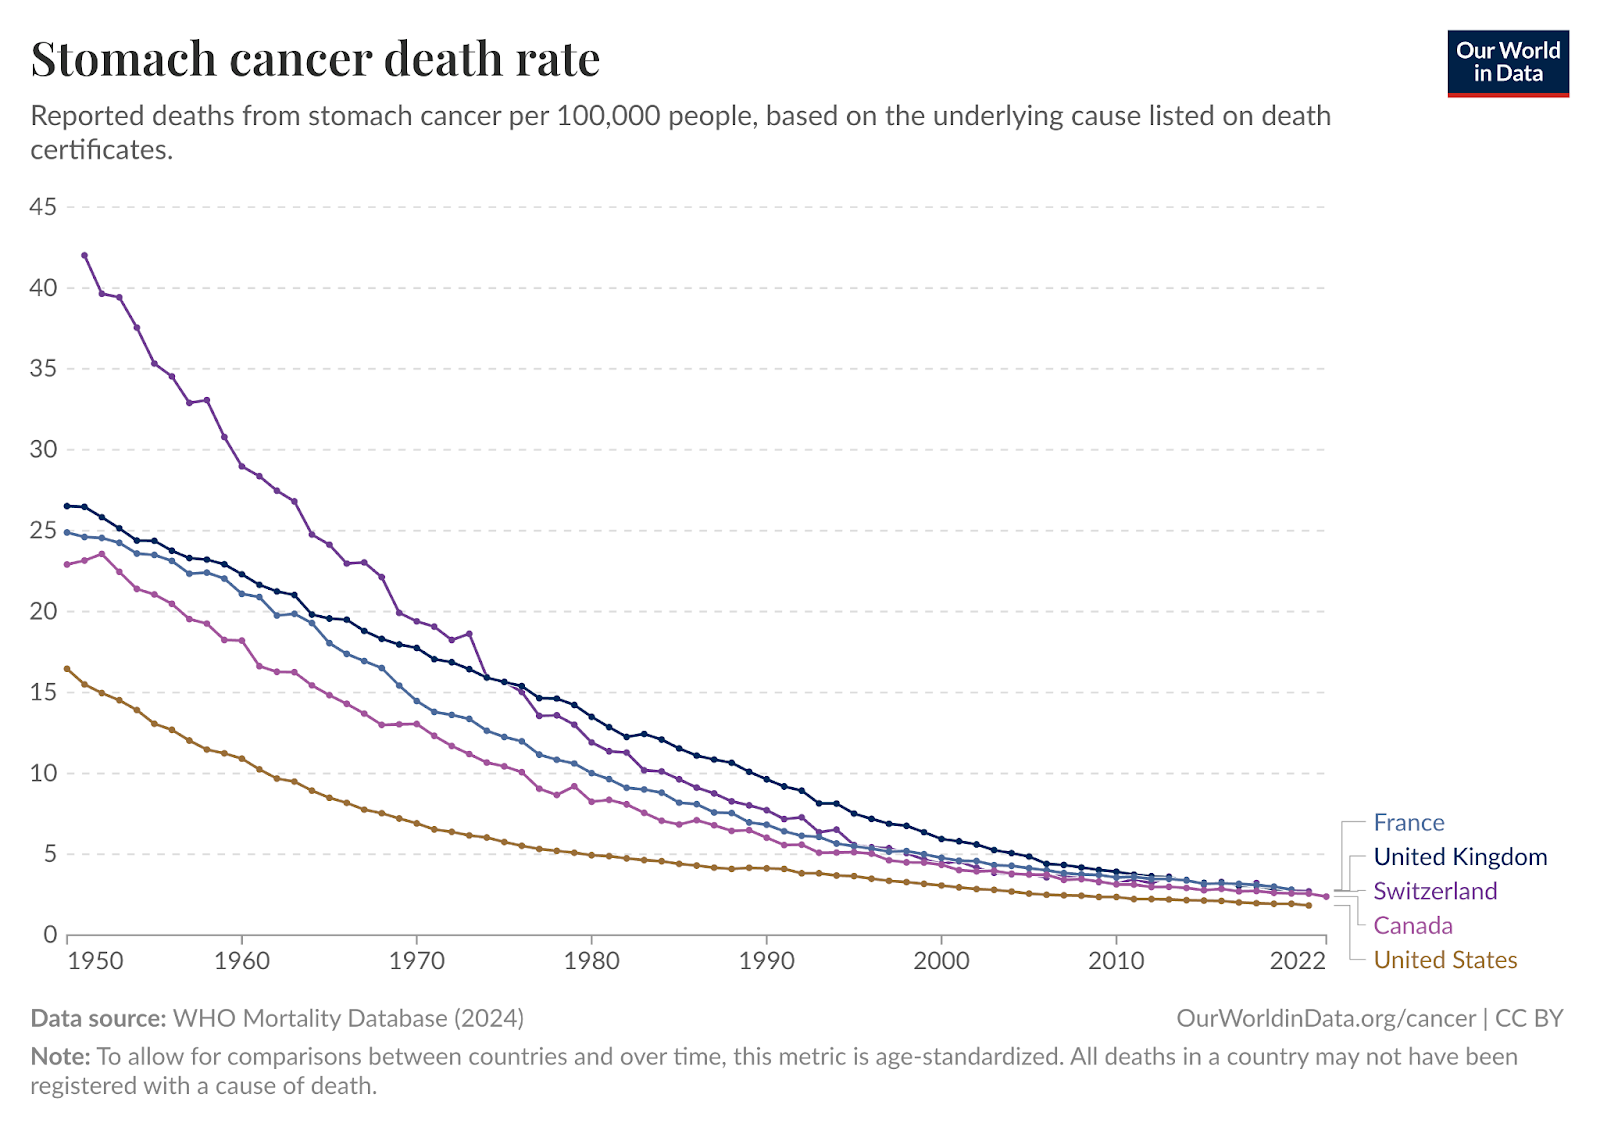
But, over the 20th century, they declined. If we look closer, we can see that stomach cancer mortality has declined more than 9-fold since 1950 in the US, which is quite substantial, and that this trend began before smoking began to decline in the 1960s.
You can see a longer version of this trend starting in the 1930s here, although the numbers differ from the ones shown here because they’re using a different reference population for age-standardization.
Most stomach cancers are caused by infection with Helicobacter pylori (H. pylori), a bacterium that can lead to chronic stomach inflammation and eventually cancer in a subset of infected people.
Scientists clearly identified H. pylori as the cause of many stomach cancers in the late 1980s and early 1990s, but stomach cancer had been declining even before that. The reasons for this are still unclear, but might have included general improvements in sanitation, food safety, and the use of oral antibiotics and antacids, since modern research suggests that H. pylori is likely transmitted through contaminated food and water, and antibiotics and antacids can eliminate H. pylori infections in the stomach.
In fact, one early clue of the bacterial cause of stomach cancers was that antibiotics and antacids (famously ‘Pepto-Bismol’) reduced stomach ulcers, which sometimes progress into cancers. It seems the reason was that they made the stomach less habitable for H. pylori — antibiotics directly kill the bacteria, while antacids reduce stomach acidity, which disrupts the specific acidic environment H. pylori relies on to colonize and damage the stomach lining.
Since the 1980s and 1990s, when H. pylori’s role was clearly identified, doctors have also been able to screen for and treat the infection directly, and thus reduce the risks of stomach cancers developing in the first place.
Separately, it seems that in several countries, colorectal cancer mortality has also declined, beginning before the decline of smoking — though my understanding is that the historical reasons are less clear.
Let’s see what this means overall with two charts below. Between 1950 and 1990, the overall cancer death rate increased only slightly because, while lung cancer was becoming more common, deaths from other major cancers like stomach and colorectal cancer were becoming less common. After around 1990, deaths from more cancer types became less common; and the overall decline became more rapid.

We’ve also seen large declines in childhood cancer mortality
Childhood cancers are typically caused by genetic mutations — such as in TP53, PRB, and other “tumour suppressor” genes, or conversely, in “oncogenes” which typically drive tumour growth. These mutations can be inherited or develop spontaneously (“de novo”) very early in development.
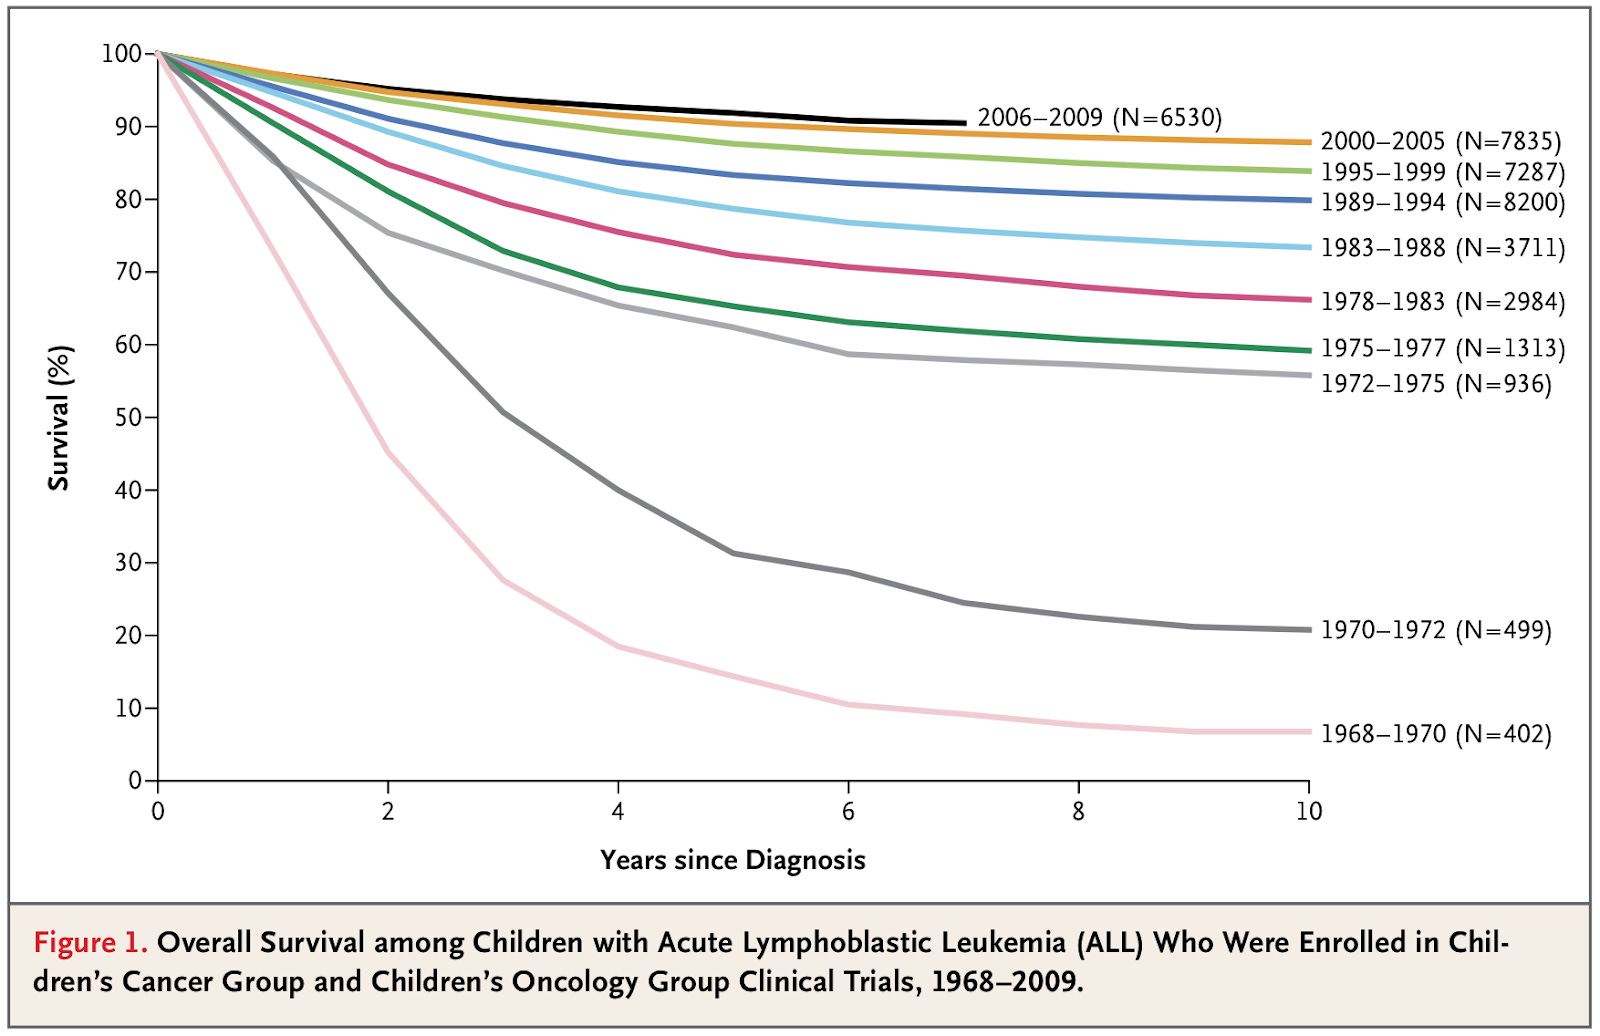
A prominent example is acute lymphoblastic leukemia (ALL), a common form of leukemia in children.
Survival rates for acute lymphoblastic leukemia among children — that is, the share who are still alive X years after diagnosis — have increased greatly over time. In the 1960s, only around 10% survived more than 5 years after diagnosis, but in recent years, >90% survive that long, which you can see below.
Survival rates like this are a common metric for studying improvements in cancer survival, but they can be affected by changes in diagnosis — the earlier people are diagnosed, the longer they appear to survive after a diagnosis, even if their trajectory hasn’t improved. Similarly, if less severe cases are increasingly diagnosed, the average survival can appear longer.
Although I think that’s less of an issue in this case, I generally tend to prefer looking at trends in mortality (as below), because they’re less affected by this problem, as this is at a point when cases are severe enough that most are captured in statistics.
In the chart below, you can see that there has been a substantial decline in childhood cancer mortality rates. This is evident for leukemias, lymphomas and multiple myeloma, and to a lesser extent, for brain cancers as well. There’s been a very large improvement over time.

For acute lymphoblastic leukemia, one major reason for progress is the use of new treatment regimens of chemotherapies. Previously, combination chemotherapies were used for shorter periods to clear leukemias in children, but some cancerous cells would remain, and most would soon relapse with new cancers forming in their central nervous system, leading to a low survival rate.
Later on, research showed that a new treatment regimen — which involved intensive treatment with eight drugs followed by consolidation treatment — helped keep them cancer-free for much longer, and was adopted as the standard treatment protocol in many countries.
In addition, genetic research helped identify specific mutations driving cancer growth among a fraction of people with acute lymphoblastic leukemia — like a mutation that created a fusion protein called BCR-ABL1.5 This led to the development of targeted therapies that block this protein’s signalling pathway and stop the leukemia cells from multiplying.
The reasons for this progress — including better treatment regimens and new treatments targeted against tumours with particular genetic mutations — have also been applied to adult cancers.
Another major breakthrough has come from vaccinating children against infectious diseases. Children with cancer are often immunosuppressed, which leaves them more vulnerable to infections. This can be either because their cancer depletes immune cells, or because treatments like chemotherapy suppress their immune system to slow tumor progression.
Many vaccines can help protect these children, including vaccines against measles, mumps, rubella, pneumococcal, influenza, and varicella (chickenpox). By reducing the overall spread of these diseases, vaccines help shield children who might not be able to mount an immune response themselves.
One example is chickenpox, which I’ve written about before. Although people often consider it mild, chickenpox used to cause around a hundred deaths per year in the US, and children with cancers were disproportionately represented in these statistics. Since chickenpox vaccination was introduced routinely in the US, chickenpox deaths have been reduced to zero.
But this isn’t all; the use of vaccination goes beyond infectious diseases.
Vaccination reduces the incidence of certain cancers
Some vaccines play a direct cancer-prevention role, which means that vaccination can reduce incidence rates of some cancers as well. That’s because some cancers are caused by infections.
This was first demonstrated in a human cancer in 1979 with the identification of HTLV1, a retrovirus that can cause T-cell leukemia and lymphoma. Earlier, I mentioned another example: the bacterium H. pylori, which can cause stomach cancer.
There are at least a dozen pathogens that we now know can cause cancers; I’ve listed some examples below.
Note that, although many of these pathogens are quite common, only a fraction of people infected develop those cancers.
Helicobacter pylori (H. pylori): A bacterium that can cause chronic inflammation of the stomach lining, leading to stomach cancer and mucosa-associated lymphoid tissue (MALT) lymphoma.
Human papillomavirus (HPV): A group of viruses that cause genital warts and cancers, including almost all cervical cancer cases, as well as a share of oral, oropharyngeal, penile, anal, vaginal, and vulvar cancers.
Hepatitis B virus and hepatitis C virus: Both can lead to chronic liver infection and inflammation, which can lead to hepatocellular carcinoma (a type of liver cancer).
Human T-cell lymphotropic virus type 1 (HTLV-1): A retrovirus that can cause adult T-cell leukemia or lymphoma.
Epstein-Barr virus (EBV): A herpesvirus that can cause several cancers, including Burkitt lymphoma, Hodgkin lymphoma, nasopharyngeal carcinoma, and certain stomach cancers.
Kaposi’s sarcoma-associated herpesvirus (KSHV/HHV-8): The virus that causes Kaposi’s sarcoma, especially in people with weakened immune systems, such as people with HIV/AIDS.
There’s strong evidence that these infections can cause cancer because scientists have observed the pathogens infecting the specific cells that then develop into pre-cancerous growths and then into tumours. In many cases, they’ve also identified the intermediate steps showing how these pathogens affect critical genes in our body that typically suppress cancer growth (“tumour suppressor genes”) or other genes that drive cancer growth (“oncogenes”).
For some, countries have also used large-scale programs to eliminate the infections using antibiotics6, vaccines, or other tools, which have reduced the incidence of those cancers as well.7
But how do these pathogens cause cancer?
Pathogens can cause chronic inflammation, which damages tissues and increases the risk of cancerous mutations during repair. They can also produce proteins that directly interfere with genes or proteins that protect against cancer.
Some cancer-causing pathogens seem to contribute to cancer through both pathways: by inflaming tissues and disrupting cell regulation.
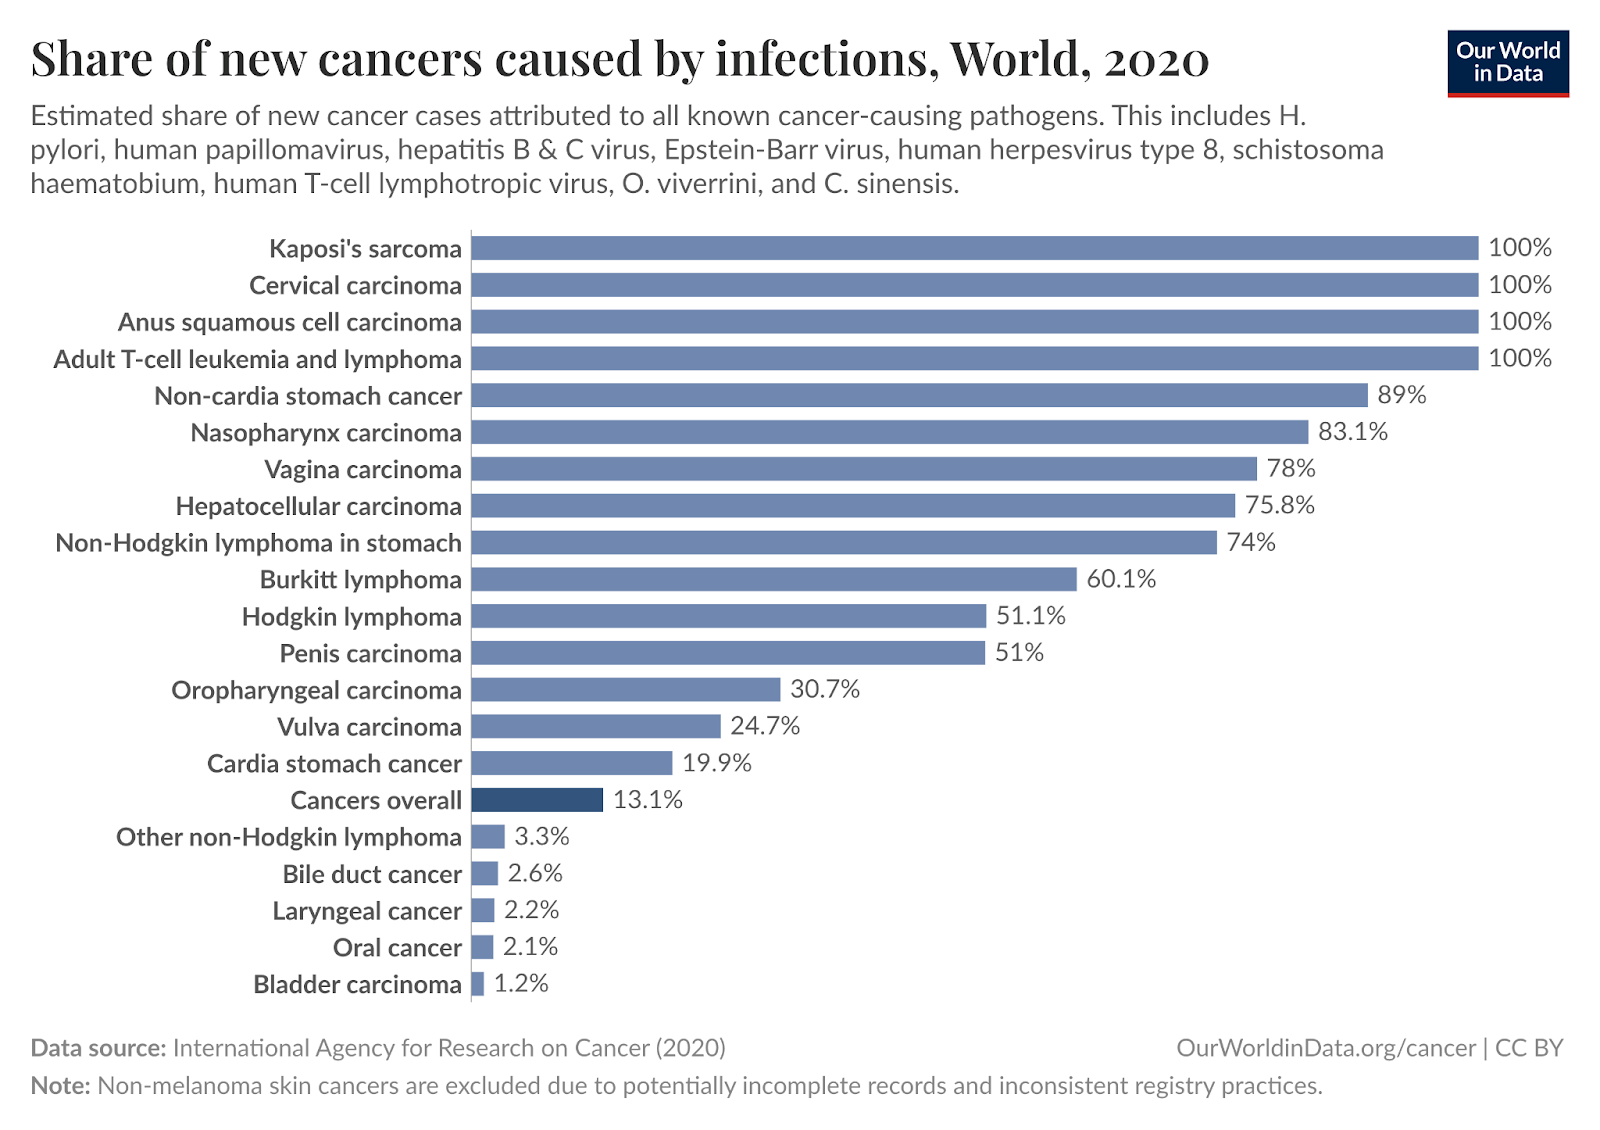
Cancer-causing pathogens generally only infect some types of tissues in the body. The chart below shows cancers that are part- or all-driven by pathogens, and the the estimated share of those cancer cases that could be prevented if the pathogens were eliminated. For example, researchers estimate that human papillomaviruses cause almost all cervical cancer cases, and that almost all cases could be prevented if they were eliminated.8
These are often tissues where, if these pathogens weren’t present, it would be extremely unlikely for cancers to form — typically because they’re stable, their cells rarely divide otherwise, and they’ve been generally protected from other exposures.
Thankfully, vaccines already exist for a few of the pathogens that can lead to cancer! And they not only prevent infections but also reduce the risk of cancer later in life.
One example is the human papillomavirus (HPV) vaccine. Randomized controlled trials have shown that it reduces pre-cancerous growths. As the vaccine has been introduced more widely, countries like the UK have seen sharp declines in cervical cancer rates, to the point where the disease has been almost eliminated in younger generations.9

Another important example is the hepatitis B vaccine, which is given to newborns in many countries and reduces the risk of liver disease, chronic inflammation, and liver cancer later in life.
Since liver cancer typically develops decades after infection, it’s often difficult to directly measure the long-term impact of newborn vaccination on cancer, even though the pathway (from hepatitis B/C infection to chronic inflammation to cancer) has been understood for some time.
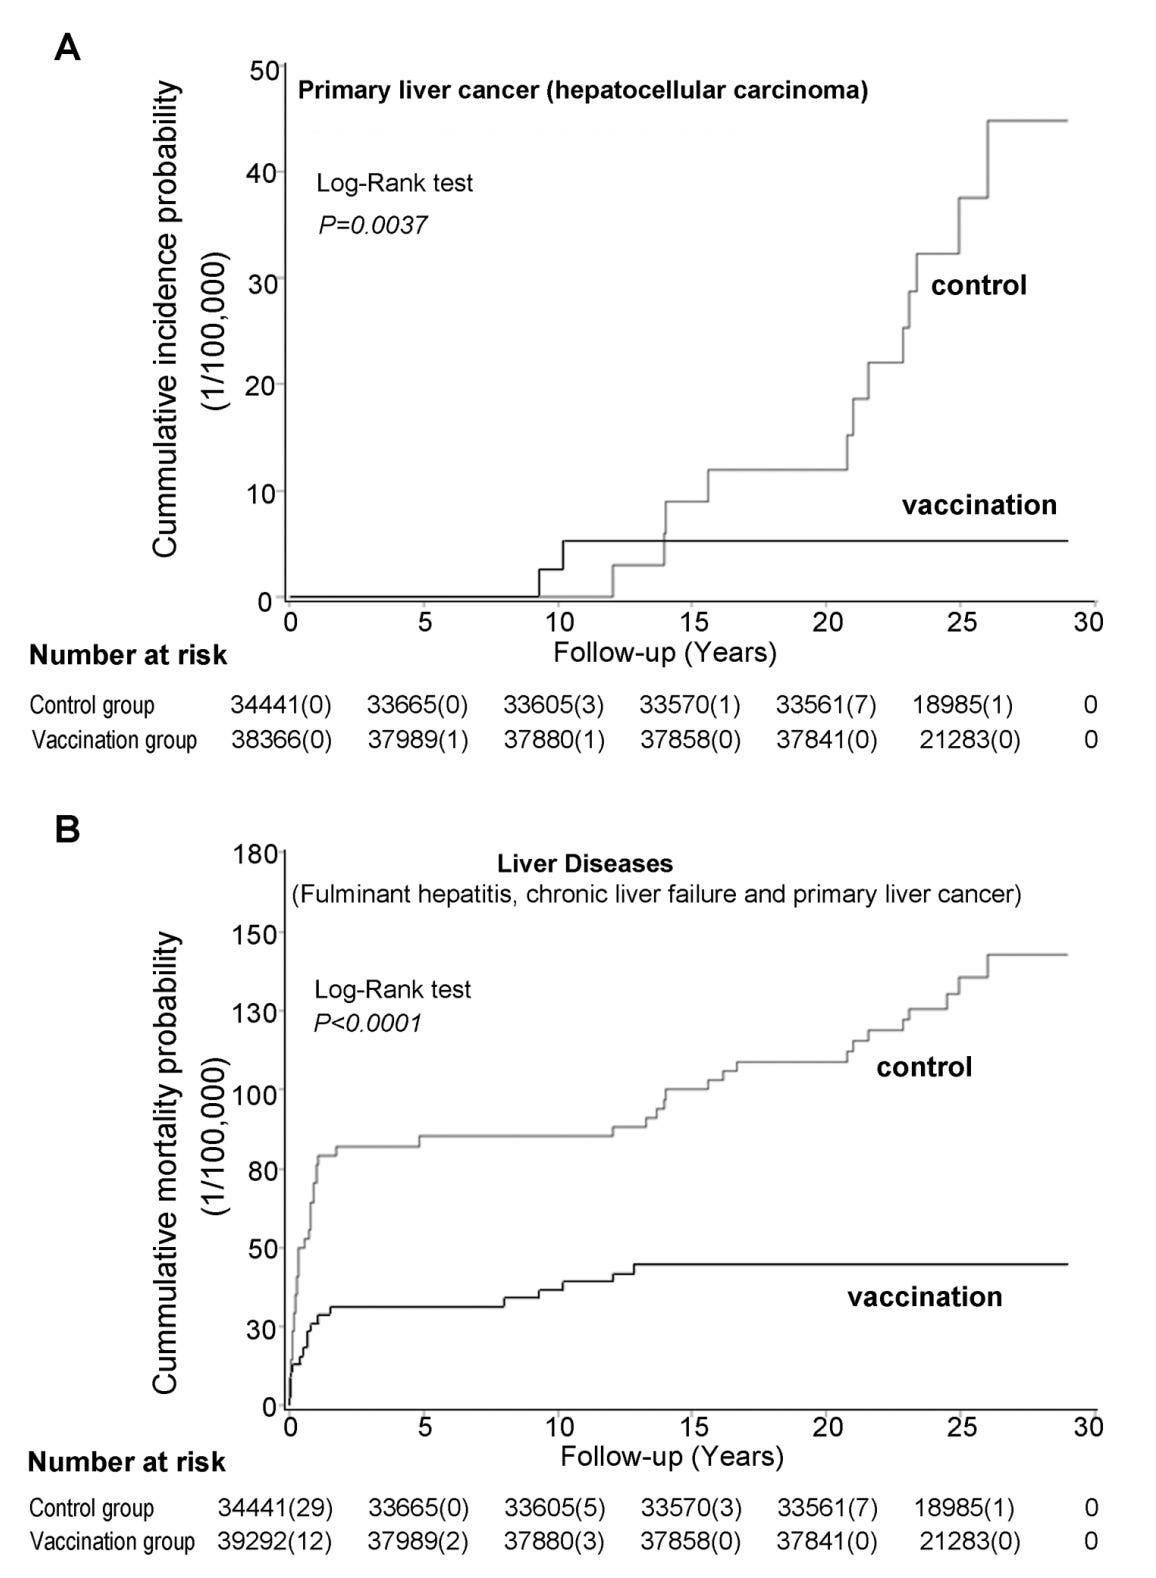
One landmark study has helped estimate the effect more precisely. It was a cluster-randomized controlled trial10, conducted in the 1980s in Qidong, China, in which entire towns — rather than individuals — were randomly selected to give the hepatitis B vaccine to all newborns.
Researchers later linked this trial data with national health records and found that, more than thirty years on, those born in vaccinated towns had a 84% reduction in the incidence of primary liver cancer, and 70% reduction in the mortality rate from liver diseases. Because the allocation was random, we can be more confident that the large difference wasn’t due to pre-existing differences between the towns.
Meanwhile, we still don’t have a vaccine for hepatitis C, which also causes liver cancer. But it can now be cured with antivirals in most infected people, as the chart below shows. This nice review describes some of the key scientific advances that made this historic progress possible.

As an aside, my friend Jacob Trefethen says there are likely multiple reasons for slow hepatitis C vaccine development. The virus mutates rapidly within each person, making it hard to target; clinical trials are difficult to run, especially considering that most new infections in richer countries are among people who inject drugs, who are harder to recruit and follow over time in studies. And animal models have been limited, with chimpanzees no longer used for ethical reasons.
Only a few vaccine trials have been attempted, and their results have been inconclusive. It’s possible that a vaccine could prevent both first-time infections and reinfections, and some researchers argue that human challenge trials could speed up development.
Breakthroughs in cancer treatment have reduced cancer mortality
I’ve sometimes heard people claim that chemotherapy and other cancer treatments only extend life by a few weeks or months. But that’s not really true. Perhaps this impression comes from looking at the benefit of individual new drugs in isolation, especially in late-stage cancers.
When you look at the full picture — including combinations of drugs, earlier diagnosis, and better care — treatment regimens have improved over time, and many cancers now have much better survival rates than they did just a few decades ago.
It’s worth remembering that until quite recently in history, it was extremely rare for anyone to become cancer-free.
Surgery was the only potential cure, and even that came with serious risks, including infection and death, especially before anesthesia and antibiotics. Today, with modern treatments and long-term follow-up, many people have become cancer-free11; and this is now common for several types of cancer.
Another point is that there actually have been some individual cancer breakthroughs that have made a huge impact, much more than just a few weeks or months. Although such large effects are rare, they do happen. We should keep these in mind to appreciate the real progress that has been made, and to learn from both the successes and failures.
Here are some major examples.
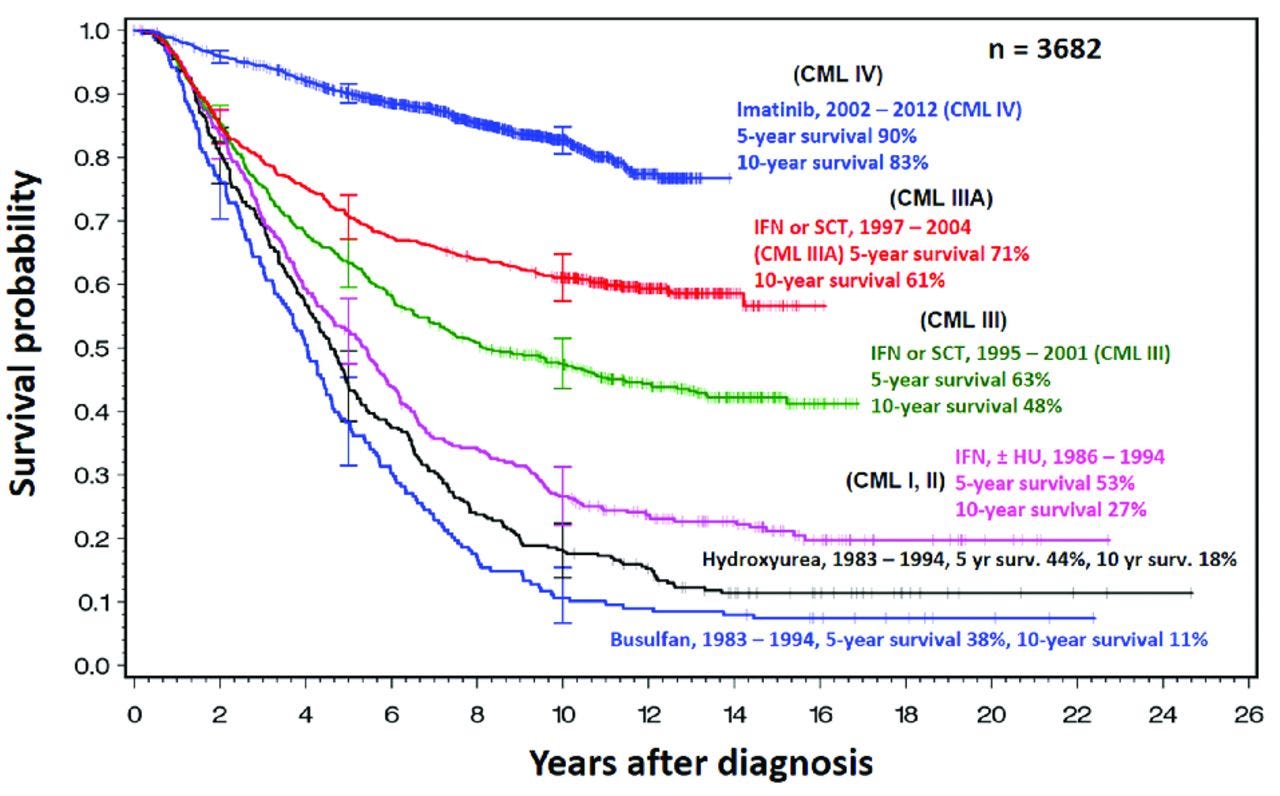
Imatinib (“Gleevec”) — a tyrosine kinase inhibitor approved by the FDA in 2001 that transformed the survival of people with chronic myeloid leukemia (CML). Before it was introduced, people with this cancer had poor chances of survival, and their treatments were generally limited to bone marrow transplants or interferon therapy.
After imatinib was introduced, survival rates rose suddenly, which you can see in the chart below. It shows survival data from all CML cases in the Italian provinces of Modena and Reggio Emilia. Before imatinib was introduced, around 40–50% survived at least 5 years after diagnosis; the year afterwards, around 80% did.

This interrupted time series chart shows the share who survived for at least 3 years (upper panel) or 5 years (lower panel) after a diagnosis of chronic myeloid leukemia. The data comes from the Italian provinces of Modena and Reggio Emilia, and shows a sudden jump in chances of survival after imatinib was introduced. Source: Di Felice, E., Roncaglia, F., Venturelli, F. et al. (2018) The impact of introducing tyrosine kinase inhibitors on chronic myeloid leukemia survival: a population-based study. Imatinib works by blocking an abnormal BCR-ABL protein (that forms as the result of a cancerous mutation) which signals leukemia cells to divide uncontrollably. By interfering with this signal, the drug can stop cancers with this mutation from progressing. The chart below shows how survival rates of chronic myeloid leukemia have changed over time.

This survival curve chart shows the share of people with chronic myeloid leukemia (CML) who survived a given amount of time. As time passed, the share still surviving declined. But over time (shown by different lines), their chances of survival have risen substantially. Each line represents people diagnosed and treated in a particular time period. The data comes from five consecutive randomized studies of the German CML Study Group since 1983. Source: Rüdiger Hehlmann (2016). Innovation in hematology. Perspectives: CML.
Trastuzumab (“Herceptin”) — a monoclonal antibody that targets the HER2 receptor, which is involved in some breast cancers. It was approved by the FDA in 1998 and substantially improved the survival of people with HER2-positive breast cancers.
In this key randomized controlled trial from 2005, you can see that people with HER2 positive breast cancer who took trastuzumab tended to survive longer than those in the control group. Around 85% survived 4 years with trastuzumab, versus 67% in the control group.

This survival curve chart shows the percentage of people with HER2-positive breast cancer who survived a given amount of time. As time passed, the share still surviving declined. But those who were taking trastuzumab survived longer than those in the control group (taking chemotherapy of doxorubicin, cyclophosphamide, and paclitaxel). The data comes from a phase three trial of trastuzumab (Herceptin). Source: Edward H. Romond et al. (2005) Trastuzumab plus Adjuvant Chemotherapy for Operable HER2-Positive Breast Cancer.


If you’ve followed this blog, you’ll also have read about some recent breakthroughs, such as osimertinib and vorasidenib, which have reduced cancer progression and death in large-scale clinical trials, and were both approved last year.
Osimertinib (“Tagrisso”) is a small-molecule drug approved by the FDA in 2024 for people with a particular type of lung cancer, EGFR-positive non-small cell lung cancer, which is more common in people without a history of smoking and especially in East Asia.
Osimertinib blocks the mutated EGFR protein that drives the cancer’s growth. A recent trial of people with stage three cancer of this type showed that the drug dramatically extended people’s survival without the disease progressing. Those on placebo survived a median of 5.6 months without the disease progressing, compared to 39 months on the drug — nearly three extra years. It also halved the risk of the cancer spreading to the brain. It shows that even at an advanced stage, sometimes targeted treatments can hold cancer back for years.

Vorasidenib (“Voranigo”) is an oral drug approved by the FDA in 2024 for people with IDH1/2-positive gliomas, a type of brain cancer that’s often diagnosed in younger adults and tends to be hard to treat.
Many patients with these tumors have mutations in the IDH1 or IDH2 enzymes, which help the cancer grow. Vorasidenib blocks both enzymes. In a recent trial, people taking it survived 27 months before their cancer progressed, compared to just 11 months in the placebo group. This is again a large impact.

These are a few examples of small molecule drugs and monoclonal antibodies that interfere with specific mutations and cancer growth signals.
But progress in survival hasn’t only come from new medicines. There have also been major advances in radiation therapy, surgical techniques, screening, and diagnostic imaging — as well as advances in cancer genetic research that’s helped identify which mutations are driving people’s tumors, so treatments can be tailored to the patient.
But how much do they matter? After all, lung cancer is now the most common cancer. Breast cancer risks are increased by smoking as well. So can’t we still say that smoking is mostly responsible for the decline in cancer mortality overall, and the other factors are relatively unimportant? Here’s why we can’t.
We live in a multi-causal world
Imagine a woman who develops breast cancer. She goes to a doctor after noticing an unusual lump on her breast, gets tested and diagnosed with stage three HER2-positive breast cancer. Soon, she’s treated with anti-HER2 therapies like trastuzumab (Herceptin), other chemotherapies, and potentially surgery and radiation therapy.
Like over three-quarters of women diagnosed with breast cancer this way in the UK, she survives at least another five years; in her case, having her tumour removed and becoming cancer-free.12
But who was responsible for her becoming cancer-free?
Is it the scientists who discovered the HER2 mutation involved in her tumour? Or the researchers who developed medicines to block those receptors? The statisticians and staff who designed and ran the trials, compiled the data, and ran the analyses? Or the healthcare workers who ran the tests that detected the mutation in her tumour? The doctors who decided to use those medicines to treat her, or the surgeons who resected parts of the tumour? Maybe it’s the hospital staff who kept the center running, or the construction workers who set up the hospital in the first place. Or perhaps it’s the woman herself, since she decided to see the doctor to begin with.
My answer is that it was all of them: they all contributed in some way to making this happen. (And I find that inspiring.)
This is an example of the multi-causal world we live in — where her survival was possible because of the influence of many individuals, whose actions together saved her life.
Without a hospital and cancer doctors nearby, it’s less likely she’d be tested and treated at all. Without research to develop HER2-positive breast cancer treatments, her chances of survival might have still been low.
Without the pharmacists who prepared her medication, the engineers who built systems to track patients’ conditions and coordinate medical supply systems, or the logistics workers who transported supplies to her hospital, her treatment might never have reached her at all.
But we can still try to estimate the number of additional lives saved by a particular factor
It’s possible that a particular breakthrough is so effective that it saves far more people from cancer than would have survived otherwise, assuming everything else stays the same. So, in a hypothetical scenario where all other factors are held constant, we could conclude that a particular factor (such as a new drug) had a large causal effect on survival.
But that doesn’t mean the other factors suddenly became less impactful.
The drug’s effect depended on many other factors being in place. Without doctors, healthcare workers, researchers, hospital infrastructure, and many other people and resources, it’s very difficult to save those lives, even if the drug itself would be effective.
This tells us two things:
We can estimate the added impact of a particular factor, by comparing it to a counterfactual scenario where that particular factor is absent. For example, we can estimate the added impact of a new drug, by comparing the actual number of deaths to the number we would expect if the drug had not been introduced.
We still can’t neatly divide up the answer between different factors like slices of a pie, because their effects can combine and interact.13 An obvious example is that screening can only save lives if treatments are available; simply knowing that someone has cancer doesn’t save them, so you can’t fully separate the impact of screening from the impact of treatments.14 This problem remains even if the different causes don’t interact, but each contribute to an outcome.
For the same reason, even though smoking has had a large impact on reducing cancer, this, counterintuitively, doesn’t make other factors less important. I’ve previously written an article about this concept.

This is why, if it was the case that — and I hate to make up a number — but even if it was the case that the decline in smoking resulted in 70% of the decline in cancer mortality overall, it would be incorrect to interpret that as meaning that the remaining factors were only responsible for 30%. In theory, other factors could contribute another 50%, 70%, or more.
That’s because these aren’t the type of percentages that can be added up; they don’t sum up to 100%. They are called ‘attributable fractions’ and are considered individually. Although this confusion has been described in epidemiological papers for decades, I find it striking how relevant it is to this discussion.
There are some additional takeaways I have from this concept.
There are often multiple ways that the same lives could have been saved. For example, people with lung cancer might be saved with new medicines, surgical techniques, or if they hadn’t smoked in the first place. In many cases, multiple things will have contributed to their life being saved, and we can’t pin it to only one factor.
But this also means we can’t just add up the effects of each approach as if they work independently. Many strategies may overlap: they protect or treat the same people. Once someone’s life is saved by one intervention, they might survive for a while without needing to be saved from the same threat again. So, adding up the number of lives saved by each method would double-count many of the same individuals and exaggerate the overall impact.
Conclusion
I started writing this post with a simple question in mind: what caused the decline in cancer death rates? But the more I thought about it, the more I realized that the question itself was trickier, and more interesting, than it first seemed.
It’s not just about cancer. It’s a question about how we understand causes and effects overall. We live in a world where things don’t happen in isolation; they interact and their effects combine. And while it might seem unsatisfying at first that there’s no single answer or percentage we can divide up and assign to each cause, that doesn’t mean we’re unable to say anything useful. We can still try to estimate the impact of specific changes, we just need to be careful not to treat them as separate or additive when they often work together.
This might sound like a conceptual or academic issue, but it shapes how we think about the world: how we evaluate new policies, how we interpret the impact of scientific breakthroughs, how we judge the value of public health programs and healthcare systems. I think it shapes how we understand scientific progress itself.
As always, I hope you enjoyed reading this. If you haven’t already, I hope you subscribe and share it with your friends! If this is your first time reading, I recommend checking out the About page.
This Substack is free, I have no plans to monetize it, and I’ll pay you if you spot any errors in this post and let me know. (Minor typos and grammatical errors excluded.) If that’s not a great deal, I don’t know what is.
See you next time! :)
– Saloni
P.S. Thanks very much to my friend Julia Rohrer for feedback on this post.
Not trying to pick on the individuals here; they just happened to be clear examples of the claim for this post.
Of course, it’s hard to truly imagine the world without smoking — would societies have consumed some other carcinogen in large quantities? I don’t know, but here I’m assuming the ‘only’ behavioural change was that smoking didn’t rise and that all else happened as observed.
Unfortunately, cancer incidence data is patchier and affected by various measurement issues, such as the introduction of new screening programs and better diagnostic tools. One issue is that cancer detection has meant that more early-stage and benign cancers are being detected than in the past, which would result in a long-term rise in the rate of reported cancer cases even if there wasn’t an underlying rise. This is true to a much greater degree for cancer cases than cancer deaths, which are more likely to be captured in statistics because they are severe.
Sometimes this is because the other locations are misdiagnosed as the primary cancer site, even though the cancer originated elsewhere. But it’s also possible that a tumour develops in a second location where it’s more severe. Typically the primary site of the cancer should be listed on a death certificate, but this can be missed.
BCR-ABL is also (more commonly) involved in chronic myeloid leukemia, as I’ll describe later on.
See this study on H. pylori elimination strategies in Taiwan as an example.
This includes using antibiotics to eliminate H. pylori, as well as HPV vaccination to eliminate cervical cancer.
For the same reasons as I describe later on — that different attributable fractions can’t simply be added up and don’t sum up to 100% — this doesn’t mean that other factors have no impact on cervical cancer cases. It’s thought that HPV is a necessary cause for cervical cancer to develop, but there are multiple ways its spread and progression can be reduced in theory, including vaccination, early screening, changes in sexual behaviour. Since school-based vaccination is so effective and easy to implement (and only one dose is required), I think it’s the best way to eliminate cervical cancers.
This kind of study is known as a cluster RCT because groups, or “clusters” like towns or schools, are randomized rather than individuals.
This is often defined as surviving more than five years without a recurrence.
Updated 28th April 2025: I noticed and corrected an error in this sentence — I mistakenly gave the impression that three-quarters of women with stage III breast cancer become cancer-free and survive at least five years after diagnosis. However, the statistic only relates to the share surviving at least five years, not necessarily becoming cancer-free; they may still be on treatment or have relapsed.
On this theme, there’s a great paper by Julia Rohrer and Nick Brown breaking down the idea of a “happiness pie”, in which “approximately 50% of individual differences in happiness are due to genetic factors and 10% to life circumstances, leaving 40% available to be changed via volitional activities.”
Surprisingly, I’ve also seen this conceptual mistake made in a press release by the National Cancer Institute, which described the causes of the decline in breast cancer deaths like this: “In breast cancer, 1 million deaths (out of 2.71 million that would have occurred in the absence of all interventions) were averted from 1975 to 2020, with treatment advances contributing to three-quarters of the deaths averted and mammography screening contributing to the rest.”
Love the conclusion especially. It feels like there is a tradition of experts trying to come up with very precise answers to complex questions like this, which are inevitably wrong and a tradition of non-experts throwing their hands up in the air and giving up on being able to get even an approximate understanding of the answers.
The future belongs to the folks who remain unsatisfied.
I don't know if the data are out there, but smoking is just the most extreme form of air pollution. It would be interesting to look at lung cancer rates in countries that still use coal-powered electricity generation like China and India as I remember they both have serious air pollution problems. Also there may a link between illnesses such as COPD and the use of gas hobs for cooking. Keep up the good work.